This feature is currently only available to users who are part of the beta program.
To join the beta, please contact support.
In this article, you will learn how to use the Lead reports built into Workiz — what each report shows, when to use it, and how to make it work for your business.
What are lead reports?
Any time you receive an inquiry about a potential job, that's a lead. Lead reports help you track what happens to those inquiries: where they came from, who's handling them, and whether they're turning into real jobs.
Instead of trying to piece together your pipeline from individual records, you can pull up a report that answers a specific question in seconds.
For example:
- “Which ad source is sending me the most leads this month?”
- “How many open leads are we sitting on right now?”
- “Which rep or tech is converting the most leads into jobs?”
- “Is our lead volume growing month over month?”
Workiz has several ready-to-use lead reports that answer these kinds of questions right out of the box. Each one is pre-configured so you can get to the answer quickly, without needing to set anything up yourself.
How lead reports work
Every lead report in Workiz is built on the same foundation, which means they all work the same way. Each report shows you a list of leads, and you can shape what that list looks like using three tools:
Filters
Filters let you narrow down which leads appear in the report. For example, you can filter to show only unconverted leads, or only leads that came in this month. If you do not set a filter, the report shows all leads.
Grouping
Grouping rolls your leads up into categories so you can see totals at a glance. For example, grouping by source shows you one row per source with a count of leads from each one (instead of listing every lead individually).
Visible columns
Each report comes with a default set of columns/fields — the pieces of information shown for each lead. You can add or remove columns depending on what you want to see.
Each of the reports below comes pre-configured with sensible defaults for filters, grouping, and columns. You can use them as-is or adjust them on the fly.
Your default lead reports
Workiz includes several pre-built lead reports designed to answer many of the common questions you're asking about your business. Here is what each one does and when you might use it.
All leads
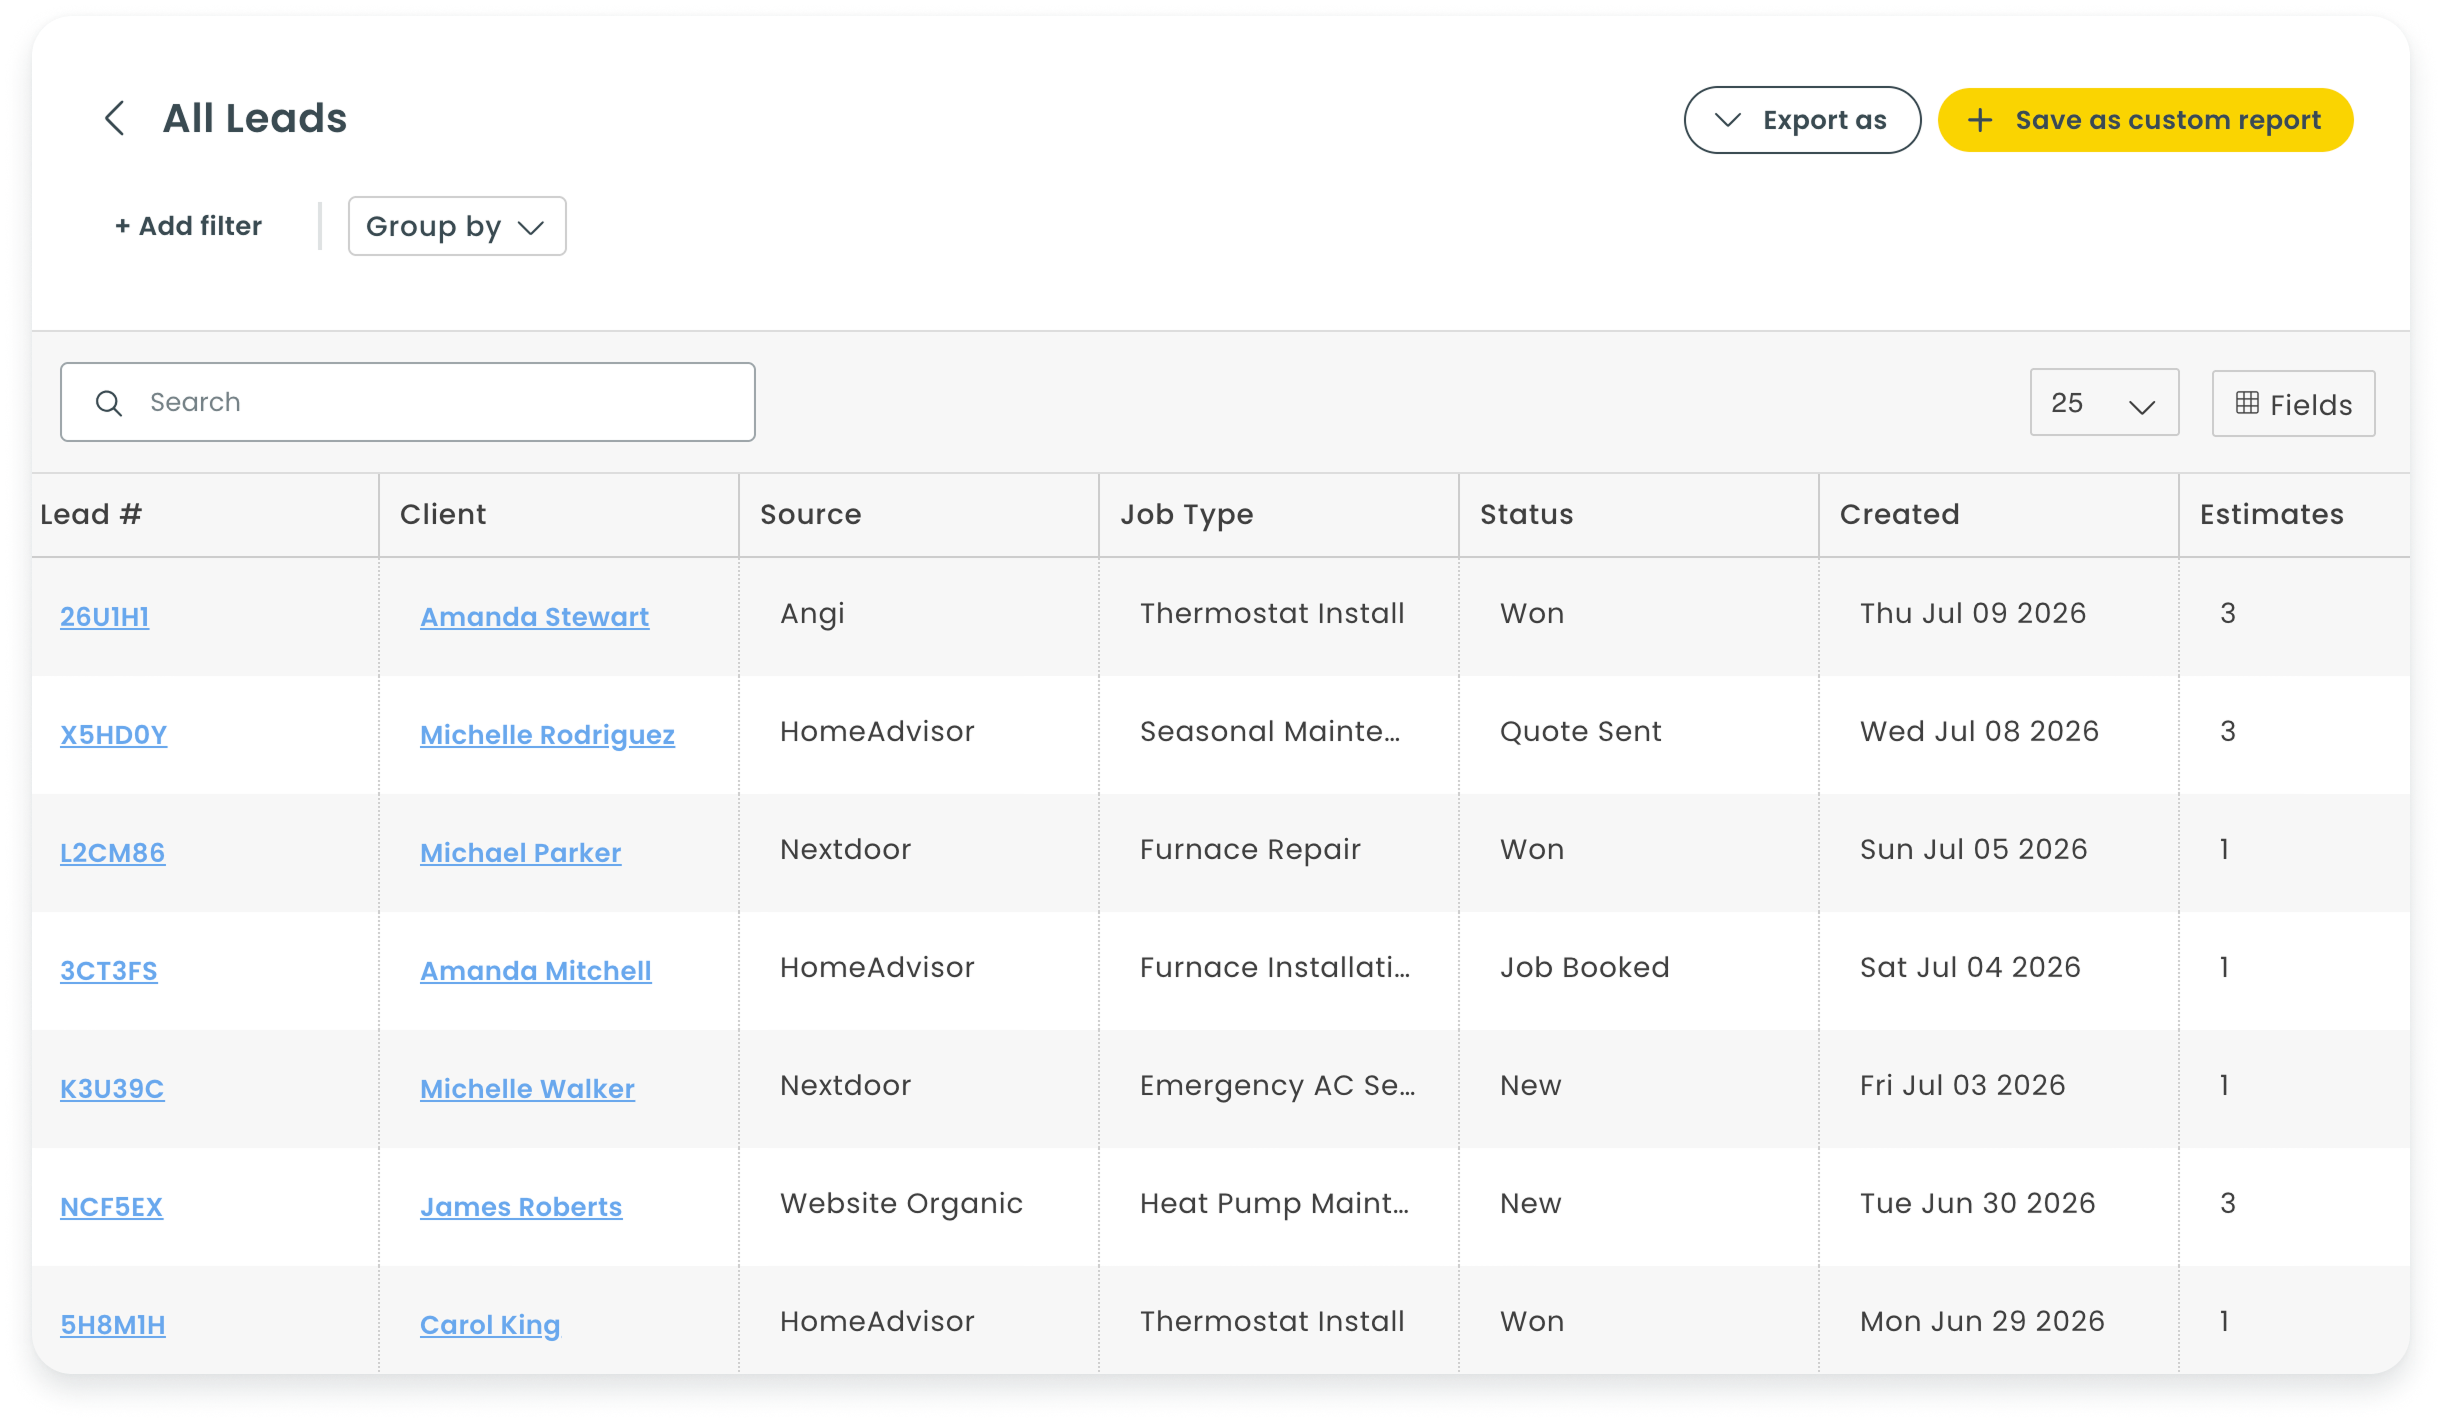
This is your full lead directory — every inquiry your business has received, listed in one place. It is the best place to start when you want to look up a specific lead, review your full pipeline, or export your lead data.
| Setting | Default |
|---|---|
| Default filters | None — shows every lead |
| Default columns |
|
| Default grouping | None — one row per lead |
| Good for |
|
By source
This report shows how many new leads came in through each channel this month — Google, Yelp, referrals, or whatever sources you track in Workiz. Use it to see where your inquiries are actually coming from.
| Setting | Default |
|---|---|
| Default filters | Created: Last 30 days |
| Default columns |
|
| Default grouping | Source |
| Good for |
|
Open by status
This report shows all leads that haven't been converted yet, grouped by their current status. It's a quick way to see where leads are getting stuck in your pipeline and what needs follow-up.
| Setting | Default |
|---|---|
| Default filters | Converted: No |
| Default columns |
|
| Default grouping | Status |
| Good for |
|
By rep
This report shows how many leads each team member created this month, grouped by who booked the inquiry. Use it to see which reps are logging the most leads into the system.
| Setting | Default |
|---|---|
| Default filters | Created: Last 30 days |
| Default columns |
|
| Default grouping | Created by |
| Good for |
|
Created per month
This report shows how many new leads came in each month over the past 12 months, along with how many of those were ultimately converted. Use it to track whether your lead volume is growing and how your conversion rate is trending over time.
| Setting | Default |
|---|---|
| Default filters | Created: Last 12 months |
| Default columns |
|
| Default grouping | Created date (month) |
| Good for |
|
Converted per month
This report shows how many leads were converted into jobs each month over the past 12 months, along with the total revenue those converted leads generated. Use it to track the actual business impact of your lead pipeline over time.
| Setting | Default |
|---|---|
| Default filters |
|
| Default columns |
|
| Default grouping | Conversion date (month) |
| Good for |
|
Saving your own custom reports
Every report above is a great starting point, but your business is unique — and sometimes you need a report that is set up exactly the way you want it, every time.
Rather than adjusting filters or groupings every time you open a report, you can save your own version of any lead report as a custom report. Give it a name that makes sense to you — something like “Google Leads This Quarter” or “Mike’s Open Pipeline” — and Workiz will save all your settings so the report opens exactly the way you left it.
When you save a custom report, you can lock in:
- The date range or filters you always use
- Your preferred grouping (by source, by status, by tech, etc.)
- The columns you want to see
To save changes to a pre-built report or create a new one from scratch, you will need access to the new Custom Reports feature. To learn more, please see this help article.
Your custom reports are always available in the Reports section alongside the built-in ones. The original pre-built reports stay untouched, so you can always go back to the default if you need to.